Friday, April 22, 2011

Q & A: Adding Charts and Graphs to My Layout

Question: How can my students add graphs and charts to their layouts in ArcGIS 9.3?

Answer:

Adding Charts and Graphs to an ArcGIS (9.x) Layout
1.       1. Create the Graph
a.       Click the Tools menu, select Graphs, select Create.
b.      There are two customization screens.  On the first one you primarily select the information to be represented. The second customizes the look of the graph.
                                                               i.      Select information for your graph.
1.       Type (bar, line, area, etc)
2.       Select the layer that the data comes from.
3.       Choose the value field that you want to be displayed on the graph
4.       Click Next.
5.       Add a title, footer, legend title, etc.
6.       Click Finish. The graph appears in a floating window.

2.       2. Add the Graph to your Layout
a.       Be sure the graph looks like you want it to look.  The graph will be added to the layout, “as is”.
b.      Right-click anywhere (except the X) on the floating window with the graph. 
c.       Select Add to Layout.
d.      Now your graph is a graphic element on your layout that you can manipulate.
3.     3.   Changing the Graph – Perhaps you realize the first try at the graph isn’t exactly what you wanted.  No worries.  This gets saved as part of your map document.  To edit this graph again.
a.       Click Tools, select Graphs.
b.      Select your graph from the bottom of the menu.  You get the floating window again.
c.       Change the physical size of the window and you’ll change the data representation.
d.      Double-click on the window to edit the data represented.
e.      Add your updated graph to the layout and delete the previous one.
                

Wednesday, April 20, 2011

Q & A: Adding Pictures to your ArcGIS Explorer Map

QuestionHow can I insert a personal photo into a pop-up for a feature I've added to my map?  


Answer:
First, know which ArcGIS Explorer you are using, DESKTOP(AGXD) or ONLINE (AGXO).  The rules are different for each interface.


Second, here are the rules...

  • Save your personal photo in an online service, such as Picasa.  It needs to be accessible from the web.
  • When you have saved your photo online, you can edit the pop-up window. This way it doesn't matter which interface you use (AGXO or AGXD).
    • AGXD: Just click that little pencil icon in the bottom right corner.  Drop in the URL of your photo.  Save it and you're all set.  You can also add a local path to a photo but remember you'll need to open the map document on that same computer for it to show up. (see http://blogs.esri.com/Info/blogs/arcgisexplorerblog/archive/2009/09/18/adding-photos-to-your-map-using-notes.aspx)
    • AGXO: Click the create features button, place the feature (point, line or polygon) on the map, click the feature, in the bottom right corner select edit and edit pop-up.  Drop in the URL of your photo on the image URL line. Click OK.
  • You can add photos in ArcGIS Explorer Desktop (AGXD) to be used in a presentation, a URL in a pop-up and to customize the symbols(markers).
  • From Esri AGX Blog on How to customize a symbolhttp://blogs.esri.com/Info/blogs/arcgisexplorerblog/archive/2010/06/03/Creating-custom-point-symbols.aspx
  • My version of the instructions: You can customize a picture to become a marker...instead of one of the stock icons.
    • right-click the place name in contents
    • select symbols
    • select manage symbols
    • browse to your picture
    • ok
    • then on the appearance tab, select the new picture as your symbol

    In the example picture above, I've used AGXD to make my marker unique and added a URL of a personal photo in the pop-up window for that point feature.

    It's really easy and offers some great opportunities to share information geographically!

Thursday, April 14, 2011

Twinkies: A Reason to Use Maps in PE Class

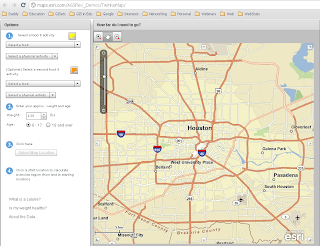
Have a look at this cool map interface!  You can map snack foods as well as the nutritional choices as they relate to calories and physical activity.

What a great way to get students involved with the outdoors and have a snack!

Check it out at http://maps.esri.com/AGSFlex_Demos/TwinkieMap/!